
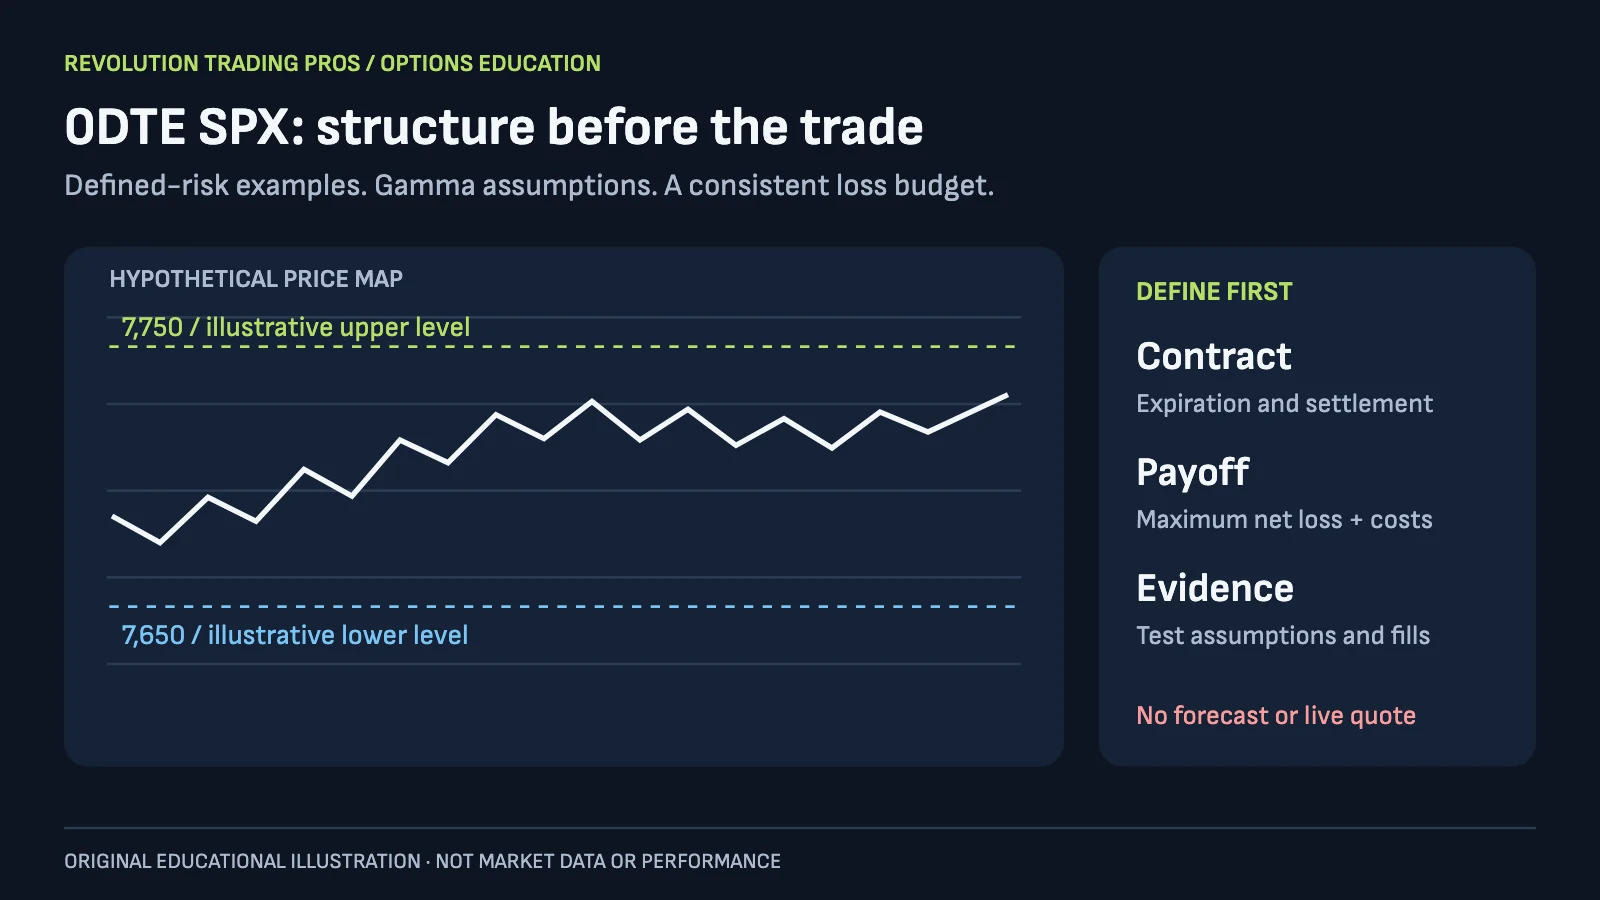
A 0DTE SPX options strategy starts with the contract, the payoff and the amount you can lose. A gamma chart can help organize a hypothesis, but it cannot establish dealer inventory, predict a closing price or turn a spread into a profitable system. This guide separates exchange facts from model assumptions and works through three defined-risk structures.
All index levels, premiums, fills and chart paths below are hypothetical teaching examples. SPX 7,700 is a convenient arithmetic baseline, not a verified November 5 market quote. Figures show original illustrations, not exchange screenshots, backtests or trading results.
1. What 0DTE changes about the trade
Direct answer: A 0DTE option expires on the trading day you enter it. Near-the-money contracts can change value sharply as expiration approaches. Defined-risk spreads cap the theoretical terminal loss of an intact position, but short holding periods leave little time to recover from an entry error, a spread widening or an unexpected announcement.
Cboe reported a record 3.6 million average daily SPX 0DTE contracts for October 2026 in its November 4 volume release. That is trading activity, not a count of unique positions or net directional exposure. The rounded release does not establish an exact monthly percentage share; dividing rounded totals would create false precision.
The Cboe 0DTE resource page separately displays 59% for SPX volume, 48% for XSP volume and 54% annual growth since 2016. Those page-level statistics are not labeled as October 2026 readings. Keep their scope separate from the dated monthly release. Neither source demonstrates that a particular entry window or strategy has positive expectancy.
Three sensitivities matter. Delta describes an option's local price response to the underlying. The Options Industry Council explains gamma as delta's response to an underlying move. Theta describes sensitivity to time passing, holding other inputs fixed. Near expiration, an option close to its strike can become especially sensitive to a small underlying move; an option far from its strike behaves differently. There is no universal curve in which every option's gamma rises through the afternoon.
Before looking for a setup, identify today's expiration, the settlement convention, the scheduled announcements and the latest time your broker permits an exit. A decision to skip the session is a complete trading decision. High turnover on an exchange does not create an obligation to participate.
2. SPX, XSP and SPY: settlement and tax differences
Direct answer: SPX and XSP are European-style, cash-settled index options. SPY options deliver ETF shares and can be exercised before expiration. At a hypothetical SPX level of 7,700, one SPX contract represents $770,000 of underlying notional; XSP is one-tenth the index scale. Notional exposure is different from premium paid and maximum spread loss.
| Feature | SPX / SPXW | XSP | SPY options |
|---|---|---|---|
| Underlying | S&P 500 Index | One-tenth SPX index scale | SPDR S&P 500 ETF shares |
| Exercise and delivery | European; cash | European; cash | American; normally 100 shares per standard contract |
| Multiplier | $100 per index point | $100 per XSP point | Normally 100 shares; verify adjustments |
| Expiration selection | Distinguish traditional AM settlement from PM-settled SPXW | Verify PM settlement and series | Check exercise instructions and broker cutoff |
| Potential tax category | Qualifying non-equity option under Section 1256 | Qualifying non-equity option under Section 1256 | Generally equity-option treatment |
Cboe's SPX fact sheet describes the settlement calculation. Its contract specifications distinguish SPXW expiration trading, normally ending at 4:00 p.m. Eastern, from traditional SPX. Half-day expiration trading normally ends at 1:00 p.m. Eastern. A broker may impose an earlier operational cutoff. The XSP product page documents the smaller index scale.
Cash settlement removes share-delivery exposure, not loss risk. A settlement near your short strike can still determine whether a spread pays or loses. With SPY, the two legs of a spread do not guarantee matching exercise outcomes. After-hours movement and exercise instructions can leave an unexpected stock position. Schwab's expiration checklist explains exercise and broker deadlines. Do not assume every protective leg becomes unavailable at exactly 4:00 p.m.
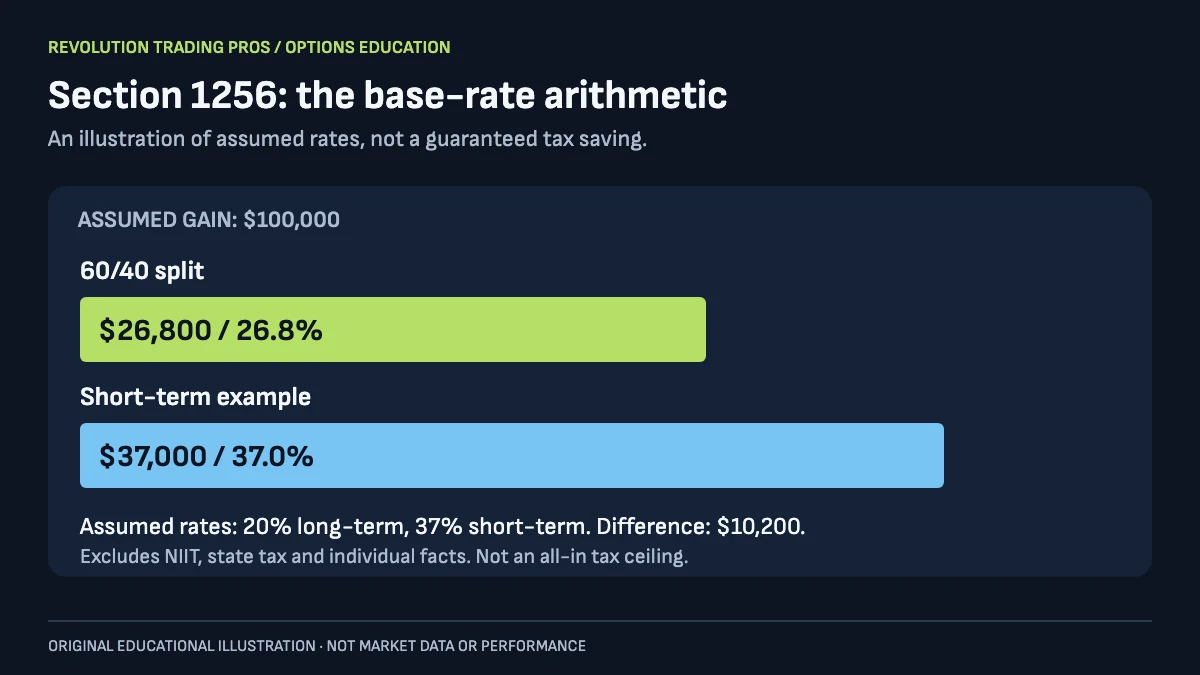
IRS Form 6781 and its instructions describe 60% long-term and 40% short-term treatment for qualifying Section 1256 capital gains, regardless of holding period. They also describe mark-to-market treatment, the wash-sale exception and a limited three-year net-loss carryback election. Eligibility, hedging and straddle rules require individual review. The retrieved form is the 2025 revision, not a finalized 2026 filing form.
Using assumed rates of 20% and 37%, the arithmetic is 0.60 × 20% + 0.40 × 37% = 26.8%. On $100,000, that is $26,800, versus $37,000 at an assumed 37% rate: a $10,200 difference before other taxes. This is not a maximum all-in federal tax rate. The IRS describes a potential additional 3.8% net investment income tax. Rates depend on the taxpayer; this U.S. example does not establish Canadian tax treatment. Ask a qualified tax professional to evaluate your actual contracts and account.
3. Gamma exposure: useful model, incomplete inventory
Direct answer: Dealer gamma exposure depends on signed positions, option sensitivities and the model used. Open interest counts outstanding contracts; volume counts trading. Neither identifies which side dealers hold. A call wall, put wall or gamma-flip level should therefore be treated as a timestamped model estimate, with explicit inventory assumptions and an invalidation condition.
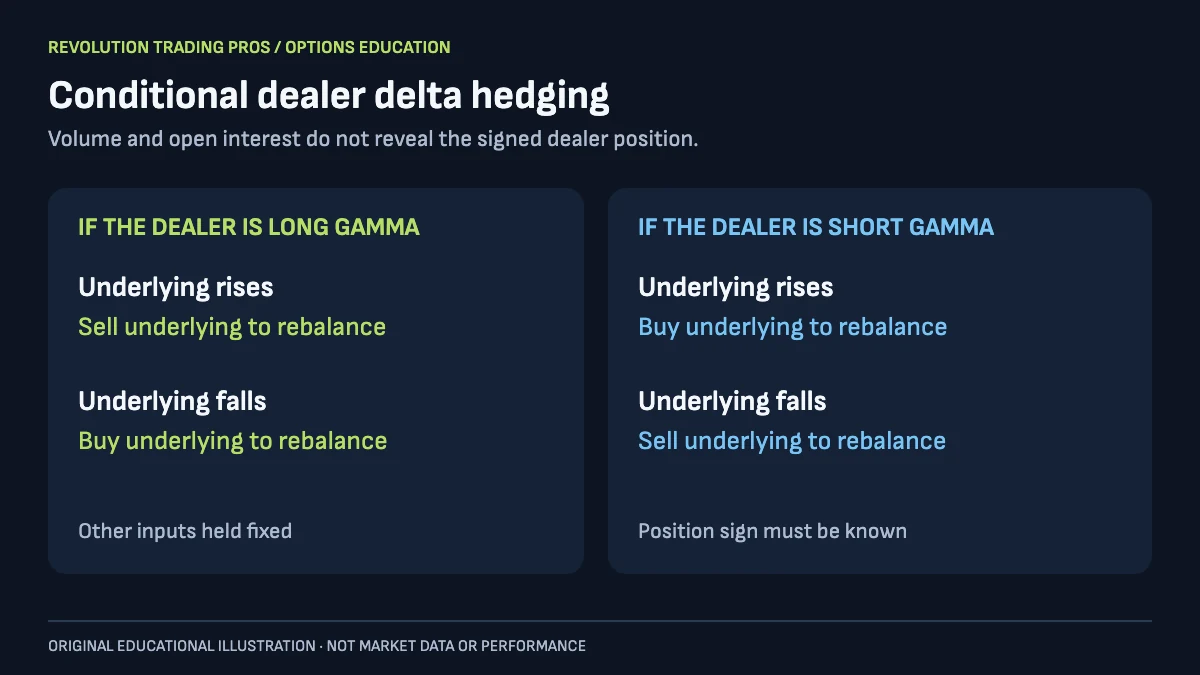
A delta-hedged dealer who is long gamma generally needs to sell underlying after a rise and buy after a fall, all else equal. A short-gamma dealer generally needs the opposite adjustment. Actual books include multiple expirations, other products and changing volatility. A market-wide directional forecast does not follow automatically from this single-position mechanism.
For a local dollar-exposure estimate per 1% underlying move, one common convention is gamma × signed contracts × multiplier × spot² × 0.01. The sign must represent the modeled dealer holding, not simply whether the contract is a call or a put. With unsigned open interest, the same expression is a gross sensitivity measure, not observed net dealer exposure.
For an arithmetic-only example, gamma 0.014, 45,000 contracts, multiplier 100 and spot 7,700 produce $37,352,700,000 per 1% move. That large number assumes every contract belongs on the same signed side. It is a local approximation with gamma held fixed across the shock, not a forecast that dealers must execute that dollar amount in futures. Near expiry, gamma can change materially during the move.
Cboe's May 2, 2025 market-impact research found balanced customer activity and limited net market-maker hedging in its sample. That historical finding does not guarantee future stability, but it directly cautions against equating gross volume with forced net hedging. A high-volume contract may change hands several times or close an earlier position.
Before using a gamma map, record the provider, observation time, expirations included, volatility inputs and positioning assumption. Ask what changes the estimate after a new trade. Compare the level with price acceptance, executable option quotes and event risk. Without a reproducible dataset and out-of-sample results, do not attach a containment probability, range forecast or profit-factor claim to that map.
4. Three spread structures and what their math proves
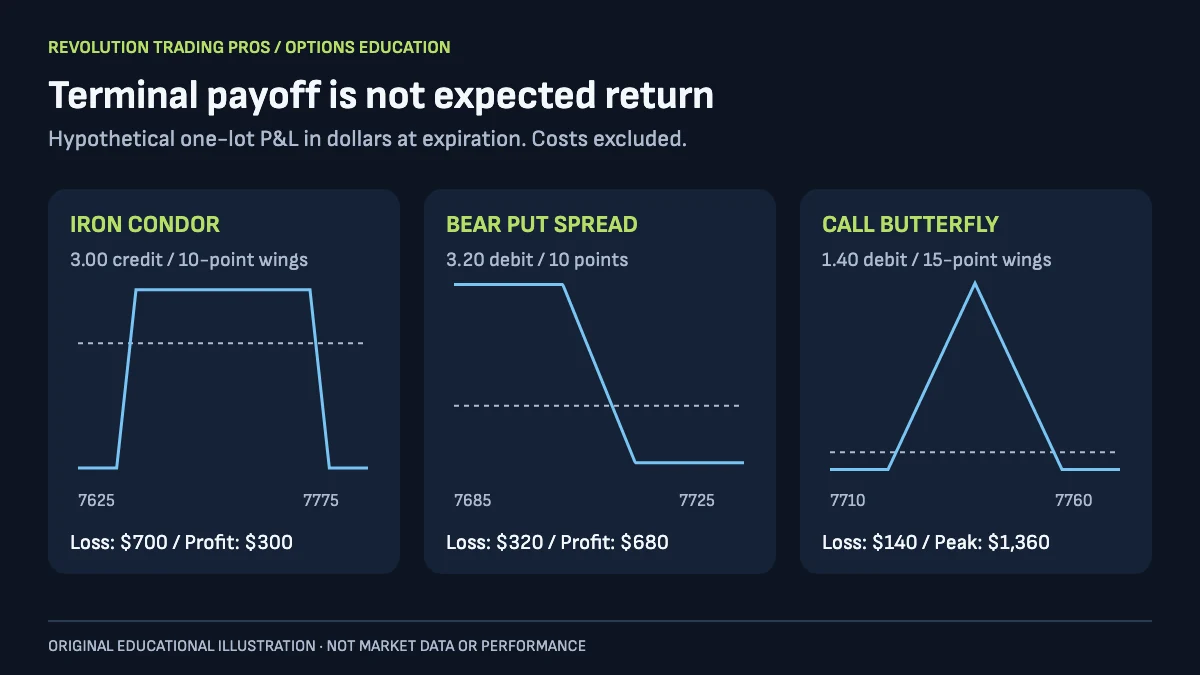
Direct answer: A spread's premium and strikes determine its terminal payoff, not its expected return. A 10-point iron condor sold for 3.00 risks 7.00 points before costs. A 10-point debit spread bought for 3.20 risks its debit. A 15-point-wing butterfly bought for 1.40 has a narrow profit tent. Each still needs an entry thesis and executable exit.
| Structure | Example legs | Premium | Maximum loss | Maximum profit |
|---|---|---|---|---|
| Short iron condor | Buy 7645 put, sell 7655 put; sell 7745 call, buy 7755 call | 3.00 credit | $700 | $300 |
| Bear put debit spread | Buy 7710 put, sell 7700 put | 3.20 debit | $320 | $680 |
| Long call butterfly | Buy 7720 call, sell two 7735 calls, buy 7750 call | 1.40 debit | $140 | $1,360 |
The iron condor: a high win rate can still lose
For the specified equal-width condor, the best outcome is retaining $300 when settlement is between the short strikes. The worst terminal outcome is losing $700 beyond either long strike. The lower breakeven is 7,652 and the upper breakeven is 7,748. Between a short and long strike, outcomes are partial profits or losses; they are not all-or-nothing.
In a deliberately simplified model with only a $300 win or $700 loss, breakeven probability is 700 / (700 + 300) = 70%. Add a flat $15 round-trip cost and the same binary model requires (700 + 15) / 1,000 = 71.5%. At a hypothetical 68% win probability, expected P&L is 0.68 × 300 − 0.32 × 700 = −$20 before costs. None of these calculations measures the actual probability of this condor.
Real expected value is the probability-weighted average of all possible outcomes, net of costs. A one-standard-deviation price band is not an observed strategy win rate. Early exits change the outcome distribution, and short strikes are different from breakevens. The correct question is whether a repeatable entry-and-exit process has evidence after realistic fills, not whether a payoff diagram looks attractive.
The bear put spread: check moneyness and price
At hypothetical SPX 7,700, the long 7,710 put is in the money and the short 7,700 put is at the money. A 3.20 debit gives a 7,706.80 terminal breakeven, $320 maximum debit loss and $680 maximum terminal profit at or below 7,700. The reward-to-risk ratio is 680 / 320 = 2.125. The quoted debit is an illustration, not a claim that this fill is available.
Delta cannot be assigned from strike labels alone; time, implied volatility and the option model matter. Selling the lower strike changes delta, gamma, theta and volatility exposure while capping the payoff. A fixed reduction in theta cost or automatic superiority to a single option cannot be inferred from the strike labels.
The butterfly: attractive peak, narrow target
The 7,720 / 7,735 / 7,750 call butterfly has equal 15-point wings. At a 1.40 debit, terminal breakevens are 7,721.40 and 7,748.60. Its $1,360 maximum profit occurs precisely at the center strike; the full $140 debit can be lost on either side of the tent. The 9.714 reward-to-risk ratio says nothing about the likelihood of reaching that peak.
Before expiration, the structure's value also depends on remaining time and implied volatility. Do not draw an invented “two hours later” profit curve without specifying and calculating those inputs. Paper-trade the actual multi-leg order, including commissions per leg, exchange fees and bid-ask friction. Four contracts within a butterfly can make costs significant relative to a small debit.
5. Build a session plan instead of a universal time signal
Direct answer: Session windows can organize observation and risk checks, but the clock does not establish a profitable entry. The timeline below is an illustrative full-day planning framework. A 2:30 p.m. Eastern review is a chosen risk checkpoint, not an exchange rule or an evidenced optimal exit. Short sessions require a different plan.
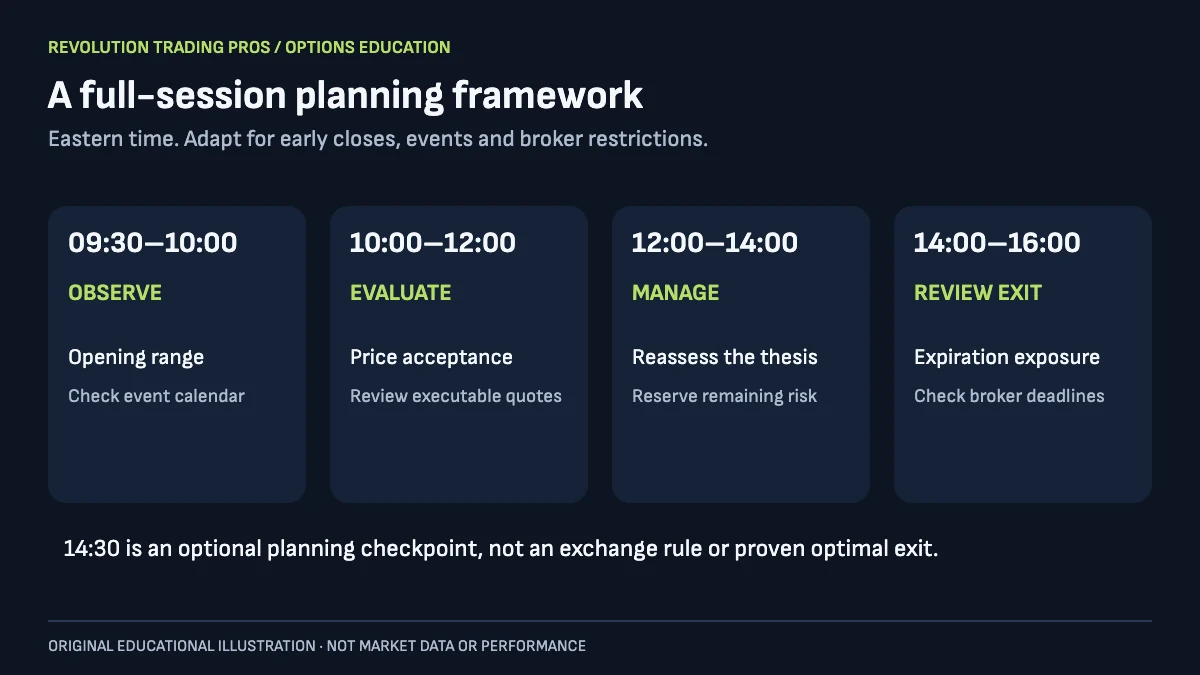
From 9:30 to 10:00 a.m., an opening-range framework observes the first 30 minutes rather than assuming the first move will continue. From 10:00 a.m. to noon, it checks whether price acceptance, market breadth and option execution quality support a testable idea. Midday is an opportunity to reassess positions and events. The late session requires a fresh decision about expiration and remaining loss capacity. These are planning categories, not recommended trades.
Scheduled releases, policy announcements, auctions and early closes can overwhelm a routine schedule. Check their actual dates and times from the responsible issuer. Equity-market breadth and futures volume can add context, but an index itself does not have a stock-like traded volume. A dark-pool print does not establish which participant initiated a directional position or whether the print represents new risk.
Define exits in dollars and order terms. If a spread is sold for 3.00 and a planned buyback is 6.00, the planned loss is $300 before costs. “Stop at twice the credit” can otherwise mean either a $600 loss or a 6.00 closing debit. Write which one you mean. A stop trigger does not guarantee a fill at its price; a stop-limit order may not fill at all. A planned stop is therefore separate from the intact spread's maximum terminal loss.
A risk limit is useful only when the next order fits inside the loss capacity that remains.
To study a proposed exit time, compare it with alternatives using the same entries, expirations, data quality and cost assumptions. Retain losing days, rejected orders and sessions with no valid setup. Separate the period used to design the rule from the period used to assess it. Until that work exists, a precise time is a policy choice rather than a demonstrated edge.
6. A chart study that does not pretend to measure GEX
Direct answer: An opening-range study can plot prices already observed on the chart. It cannot identify dealer gamma without option-chain and signed-position inputs. The accompanying ThinkScript example records the 9:30 to 10:00 a.m. range and its midpoint. It provides no gamma-flip estimate, probability, volatility valuation or buy/sell recommendation.
An opening-range midpoint is a price statistic, not a “synthetic gamma flip.” That name implies information the calculation does not contain. The corrected study uses descriptive labels: opening-range high, opening-range low and opening-range midpoint. A midpoint crossing means the chart crossed that price; it does not establish a change in dealer positioning.
Use a one-minute or five-minute intraday equity/index chart with the complete opening window loaded. Schwab documents GetYYYYMMDD and SecondsFromTime; the latter is not suitable for daily-or-longer aggregations. The example is source-reviewed against these references, but has not been compiled or replayed in thinkorswim here. Verify session handling, daylight-saving behavior, missing bars and a second trading day in paperMoney before relying on the display.
# RTP Opening Range: educational price levels, NOT dealer GEX.
# Use a complete 1-minute or 5-minute equity/index session.
# Source reviewed; thinkorswim compilation/replay is not verified.
declare upper;
input showMidpoint = yes;
def intraday = GetAggregationPeriod() < AggregationPeriod.DAY;
def regular = intraday and SecondsFromTime(0930) >= 0 and SecondsTillTime(1600) > 0;
def opening = regular and SecondsTillTime(1000) > 0;
def newSession = GetYYYYMMDD() != GetYYYYMMDD()[1] or !regular[1];
def rangeHigh = CompoundValue(1,
    if regular and newSession then (if opening then high else Double.NaN)
    else if opening then Max(high, rangeHigh[1])
    else rangeHigh[1],
    if opening then high else Double.NaN);
def rangeLow = CompoundValue(1,
    if regular and newSession then (if opening then low else Double.NaN)
    else if opening then Min(low, rangeLow[1])
    else rangeLow[1],
    if opening then low else Double.NaN);
plot OpeningHigh = if regular and !opening then rangeHigh else Double.NaN;
plot OpeningLow = if regular and !opening then rangeLow else Double.NaN;
plot OpeningMidpoint = if regular and !opening and showMidpoint
    then (rangeHigh + rangeLow) / 2 else Double.NaN;
OpeningHigh.SetDefaultColor(Color.CYAN);
OpeningLow.SetDefaultColor(Color.MAGENTA);
OpeningMidpoint.SetDefaultColor(Color.YELLOW);
AddLabel(!intraday, "Use a complete 1-minute or 5-minute session", Color.RED);
It deliberately omits an arbitrary expected-move adjustment and VIX1D/VIX trade labels. Cboe explains that the indices use different horizons and time conventions. A ratio alone does not establish that today's particular strike is cheap, rich or profitable. If you add volatility bands later, document the price anchor, time basis and model, and distinguish an estimate from a confidence guarantee.
7. Margin eligibility and a consistent loss budget
Direct answer: FINRA adopted replacement intraday margin standards effective June 4, 2026, with a firm phase-in ending October 20, 2027. A reader on November 5, 2026 must check the broker's implemented framework and house requirements. A regulatory change does not automatically approve a particular account, options strategy or position size.
FINRA Regulatory Notice 26-10 replaces the old pattern-day-trader counting and $25,000 requirement under the new framework, while allowing firms time to implement. It permits, rather than mandates, real-time monitoring. The notice's 90-day restrictions depend on repeated unsatisfied deficits and specified timing; they are not an automatic freeze whenever a trade loses more than $1,000. The smaller of 5% of equity or $1,000 is an exception within that rule, not a recommended risk allowance.
Ask your broker which rules apply now, what approval the spread requires and when it may liquidate positions. Do not assume a $2,000 balance is enough for any SPX trade or that a cash account allows unlimited multi-leg trading. Account permissions, collateral and settled funds are separate constraints.
For a hypothetical $25,000 account, a chosen 1% per-trade ceiling is $250 and a separate 3% daily ceiling is $750. These are example policy settings, not suitable limits for every reader. If one intact spread can lose $320 before fees, zero contracts fit the $250 ceiling. A smaller product, different structure or no trade is required; rounding up would defeat the limit.
A second calculation protects the daily budget. Subtract realized losses and the reserved maximum loss of all open positions from the daily ceiling before evaluating another order. If $500 is already lost and $150 remains reserved for an open trade, only $100 of the $750 budget remains before costs. A new $250-risk trade does not fit. Two full losses at a 2% trade limit would already exceed a 3% daily budget.
Enter multi-leg orders as a combination and review the actual fill. Closing only the protective leg changes the risk profile. Do not describe an uncovered short put as having mathematically unlimited loss; its theoretical loss is large but bounded by the underlying falling to zero. Uncovered short calls can have unlimited loss. Neither belongs in this guide's defined-risk examples.
Keep a journal of the contract, observed quote, fill, costs, thesis, maximum loss, exit rule and realized result. Distinguish a missed fill from a completed trade. Evaluate enough observations to expose drawdowns and uncertainty before considering real-money use. A simulation or favorable reward-to-risk ratio is insufficient evidence of a repeatable advantage.
8. Next steps and risk disclosure
Direct answer: Start by verifying contract specifications, account permissions and the entire payoff. Then test one explicit hypothesis with realistic costs and complete records. Use gamma estimates as conditional context. Treat this article's numbers as worked examples, not today's market levels, a verified desk track record or a promise that a strategy will earn money.
Explore the day-trading room, the SPX Profit Pulse service page and the Sunday Alpha watchlist for the site's current educational offerings. For smaller-product education, see the small-accounts room. These links do not substantiate a particular trading result or a promise of real-time dealer inventory. Read the service descriptions and risk disclosure before deciding whether an offering fits your needs.
Risk disclosure: This material is general financial education, not an individualized recommendation, tax opinion or offer to transact. Options can lose the entire premium or the maximum loss of an intact spread quickly. Fees, slippage, liquidity, exercise instructions and changes to the legs affect outcomes. Hypothetical calculations are not actual performance. Read the OCC's Characteristics and Risks of Standardized Options, obtain your broker's current requirements and consult qualified financial and tax professionals about your circumstances.
Execute Institutional Order Flow With Defined Risk
Join our live stock, ETF, and options trading rooms or follow our pre-planned video watchlists built for working professionals and small accounts.
Frequently Asked Questions
What does a gamma-flip level actually tell me?
It identifies a zero crossing in a particular gamma model under its positioning and volatility assumptions. It is not an observed inventory balance or a guaranteed support or resistance level.
Does a 70% win rate prove an iron condor is profitable?
No. Payoff sizes, partial outcomes, exits and costs matter. In a binary model with a $300 win and $700 loss, 70% merely breaks even before costs. That model does not measure the real trade probability.
Are SPX and SPY options settled the same way?
No. SPX index options are European-style and cash-settled. Standard SPY ETF options normally deliver shares and have American-style exercise. Check the exact expiration, settlement and broker deadlines.
Has the pattern-day-trader framework changed in 2026?
FINRA Notice 26-10 adopts replacement intraday margin standards effective June 4, 2026, with a firm phase-in ending October 20, 2027. Ask your broker which framework and house requirements apply to your account.
Does the ThinkScript study calculate dealer gamma exposure?
No. It plots the observed opening-range high, low and midpoint. It has no option-chain or signed-inventory inputs and has not been compiled or replayed in thinkorswim as part of this review.